The dynamics of household consumption
Context:
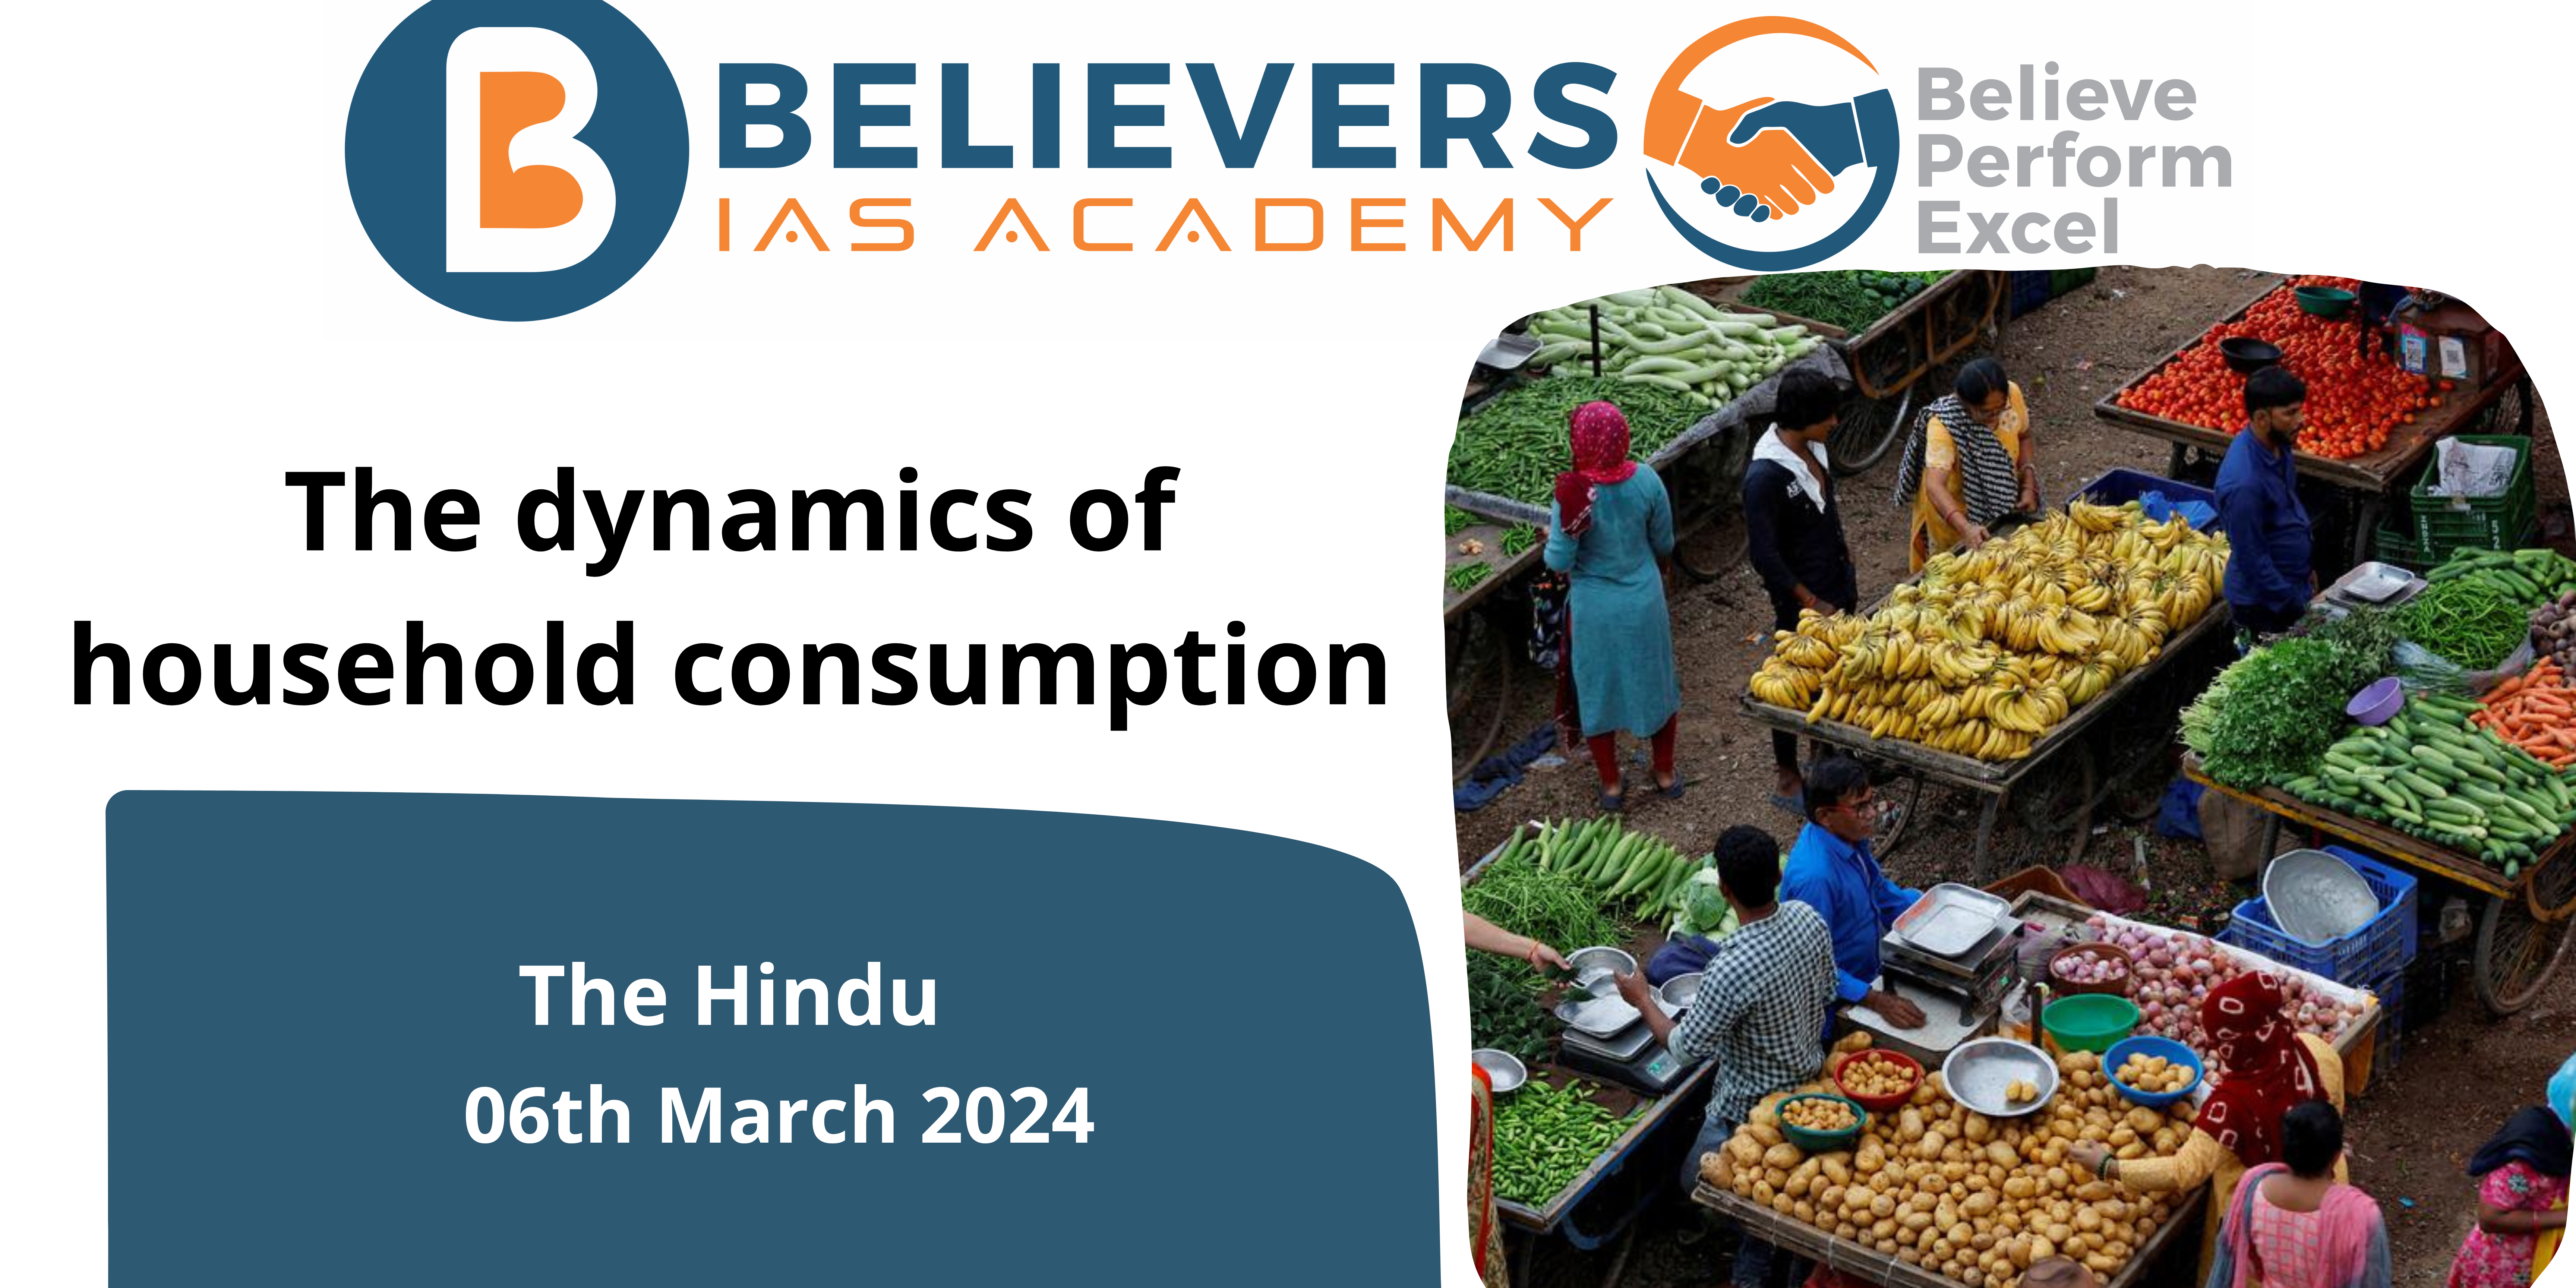
The Household Consumption Expenditure Survey (HCES) 2022-23, recently released by the NSSO, offers crucial insights into household spending patterns in India.
- The survey, conducted over two phases, employed modern data collection methods and covered a significant sample size of households.
Relevance:
GS-03 (Economy)
Key Highlights:
- Significance of the HCES: The HCES is instrumental in understanding how households allocate their spending across various categories, providing valuable information for policymaking and economic analysis. By capturing detailed expenditure data and demographic information, the survey contributes to the calculation of Consumer Price Indices and the estimation of poverty rates.
- Methodological Innovations: The 2022-23 HCES introduced several methodological innovations to enhance data collection efficiency and accuracy. By adopting computer-assisted personal interviews and employing a strategic sampling design, the survey aimed to capture a comprehensive picture of household consumption patterns in a rapidly changing economic landscape.
- Insights from the Survey: The fact sheet of the HCES 2022-23 offers intriguing insights into India’s economic landscape. It reveals disparities in average monthly per capita expenditure (MPCE) between rural and urban areas, with urban households generally spending more. Additionally, the survey highlights trends in expenditure patterns, including changes in spending on food items and the increasing share of non-food expenditures, particularly on durable goods.
Highlights of the Recent Household Consumption Expenditure Survey:
Household Consumption Expenditure Survey (HCES):
- Conducted by the National Statistical Office (NSO) every 5 years.
- Aims to collect data on household consumption patterns regarding goods and services.
- Used to derive macroeconomic indicators like GDP, poverty rates, and Consumer Price Inflation (CPI).
- Helps calculate estimates for Monthly Per Capita Consumer Expenditure (MPCE) and analyze distribution across different income categories.
Poverty Reduction:
- NITI Aayog reported a decrease in poverty to 5% based on the latest consumer expenditure survey.
- The 2017-18 survey findings were not released due to “data quality” concerns.
MPCE Trends:
- The recent survey calculated average MPCE without imputing values of items received free through social welfare programs.
- Urban household MPCE increased by 33.5% to ₹3,510, and rural household MPCE increased by 40.42% to ₹2,008 since 2011-12.
Food Spending Patterns:
- In 2022-23, 46% of rural and 39% of urban household expenditure was on food items.
- Share of expenditure on cereals and pulses within overall food consumption expenditure has decreased gradually.
MPCE Distribution:
- The bottom 5% of rural population had an average MPCE of ₹1,373, while the top 5% had ₹10,501.
- Sikkim recorded the highest MPCE in both rural (₹7,731) and urban (₹12,105) areas.
State-wise Variations:
- Sikkim had the highest MPCE, while Chhattisgarh had the lowest.
- Meghalaya and Chhattisgarh exhibited the highest rural-urban MPCE difference among states.
UT-wise Variations:
- Chandigarh had the highest MPCE among UTs, while Ladakh and Lakshadweep had the lowest.
- Urban areas generally showed higher MPCE compared to rural areas in UTs.
Non-Food Spending:
- Share of expenditure on non-food items has increased over time.
- Spending on conveyance saw the highest share among non-food items.
Fuel and Light Spending:
- Fuel and light expenditure used to be the highest among non-food items until 2022-23.
- Decline in food spending suggests increased incomes and allocation to other expenses like medical, clothing, and education.


